


Over the years of writing this newsletter I have talked a lot about supply & demand, home values, interest rates, as well as a host of other important topics. One area I have not really touched on very much is the topic of “days on market”. In addition to how much they can expect to sell their home for, most prospective sellers would like to know how much time they can anticipate it to take to market and sell their home. This is, of course, a reasonable question and it’s worth explaining why the metrics we use to determine the answer aren’t as straightforward as we’d like or it would seem. Like most other metrics there are many different ways to look at this, but I will focus primarily on average days on market, or “DOM”. Also like other metrics, it is helpful to provide some context and give you something to compare to so you can understand in relative terms what “high” DOM would be.
Before we dive into the numbers I’ll explain how the metric itself is derived, and how real estate agents can affect the days that are reported in the multiple listing service (MLS). In the MLS there are two different ways DOM is reported, first is ADOM (Agent Days on Market) and the second is CDOM (Cumulative Days on Market), which is the total number of days, even if the seller switched agents. ADOM is what most agents care about because it shows how long it took them, the agent, to sell the house. CDOM is how long it actually took, which is what the seller cares about. It would make sense that the days on market would be calculated from the time the listing is first taken active in the MLS to the date the contract is accepted, as this is their marketing time. This is true only if the listing is taken to the “pending” status when the contract is accepted. If, however, the agent changes the status to “UCB” (under contract accepting backups), this is still technically an active status and, therefore, the DOM continues to accumulate until the listing closes or is taken pending. If the buyer has a home to sell before they can close, the agent may take the listing to the status “CCBS” (contract contingent on buyer sale), which also continues to accumulate days because it is also technically an active status. Confused yet? Exactly. This is why DOM is not a terribly reliable metric, but it’s the best we have. To complicate matters further, if an agent or seller wants to reset their DOM in the MLS, they can take the listing off market for 45 days, put it back on, and then it shows as zero.
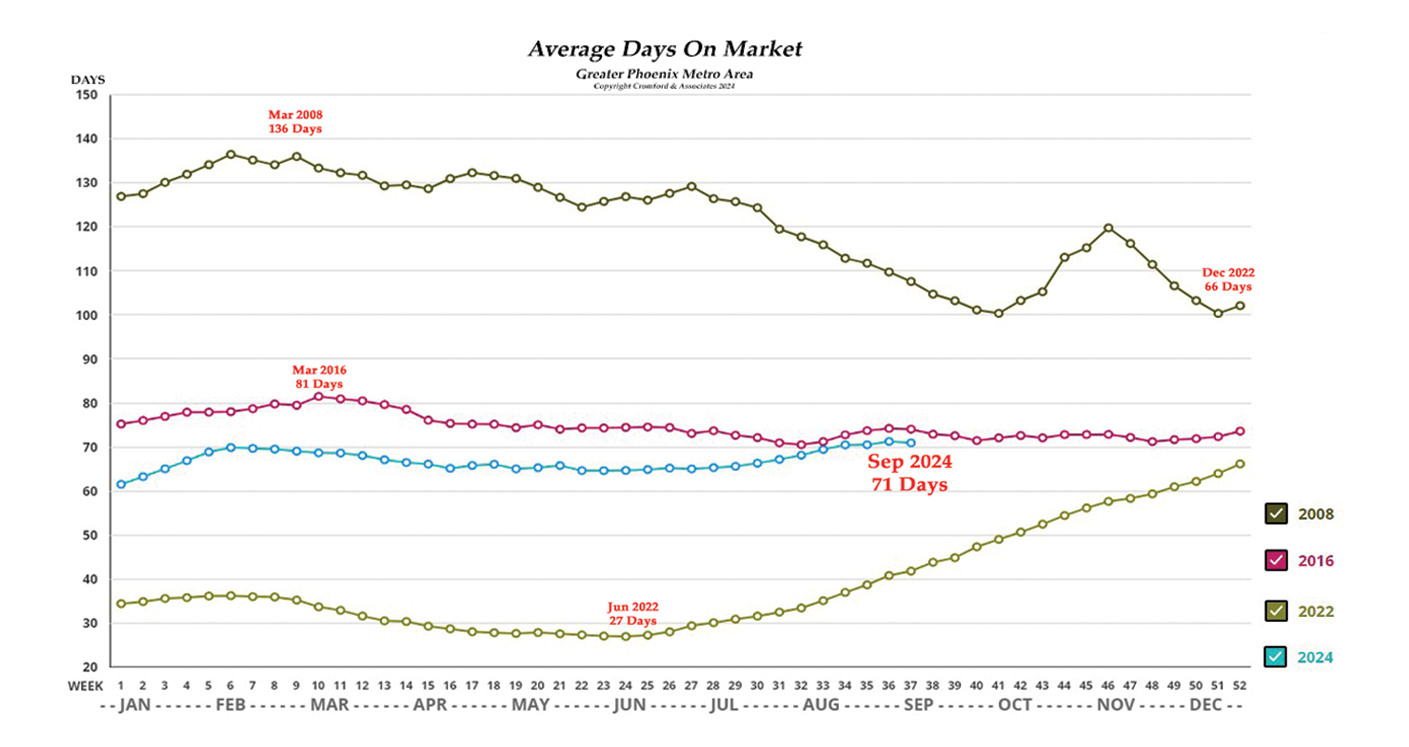
You might be asking why days on market matter at all if there are so many ways the number can be affected. To put it simply, it’s quite flawed but as I said, it’s also really the best we have. We can still glean information from it and we can still see change relative to other years, which can be useful. Referring to the graph below, you can see the rapid rise through the second half of 2022, correlating to the rise in interest rates. You can also see by comparison how much longer it’s taking in 2024 to sell a home than it took in early 2022, and by comparison to that, just how lucky we should find ourselves that it’s not taking an average of 136 days like it was in 2008. Today’s current average DOM is 71 days, which is not too far off from a “normal year” like 2016, but sure feels like a long time compared to the 27 days it was taking only a few short years ago. It is also worth noting that averages are just that, average, and that means some homes are selling far quicker and some are taking considerably longer. Every home is different, and even in slow, depressed markets some homes can sell in a day, while in super-hot seller’s markets, some homes can take many months to sell. Price and presentation, as well as many other factors can affect how long it takes to sell a home. So, if you’re considering selling your home anytime in the near future and would like to talk about your specific situation, please give me a call. I’d love to talk nerdy with you :)