


 The housing market is one of the largest sectors of the overall economy, which is part of why it is so essential to pay attention to it, as it affects us all in different ways. As you might imagine, there are many moving parts, so working to understand the current market and to forecast where it might be headed can be complex and nuanced. There is a vast amount of data available with myriad ways to use it to interpret any particular facet of the market we’re examining. We often discuss supply & demand, the market index, and interest rates, but this month, I thought it would be beneficial to explore a different metric: the Listing Success Rate, or LSR.
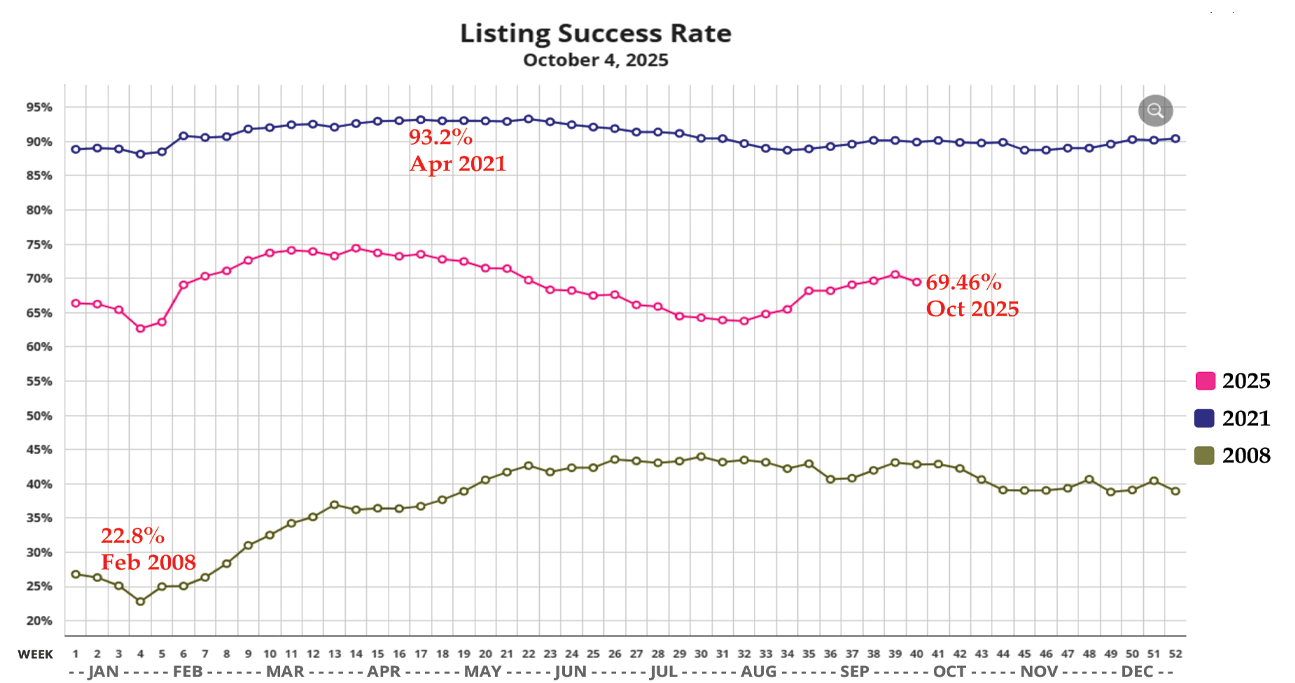
This metric can be a valuable tool for understanding the health of the market because it measures the percentage of listings that close with a successful sale, rather than being withdrawn from the market due to cancellation or expiration. The higher the number, the better it obviously is for sellers, but like many things, it’s helpful to look at it in proper context. Currently, in the broader Phoenix Metro Area, 69% of listings are successfully closing, which may or may not sound like a lot, but it is right in line with the long-term historical average. However, when you compare this to the most recent boom from 2020 through early 2022, where the success rate reached as high as 93%, this might feel like a pretty tough market. By contrast, in 2008, when the housing market was in freefall, the LSR reached an all-time low of 22.8%. THAT was a tough market, and it bears reminding that, while it’s not as easy to sell a home today as it was a few short years ago, it’s not half as bad as some might think.
Digging deeper into the Listing Success Rate allows us to break the market down into a bit finer detail, and stratify it by city or zip code, and even by price range. For example, for the entire city of Peoria, the LSR is 64%, which is below the Greater Phoenix Metro area. The northern zip code of 85383 is 58.9%, and for homes between $800-$1m, the number is 56%. Put simply, if you’re selling a million-dollar home in North Peoria, you have a little better than a 50/50 chance of your home selling in today’s market. If, on the other hand, you were selling a million-dollar home in Scottsdale, your chances go up to 76%. The more granular the data, the more it can be applied to any one specific listing.
Understanding your chances of success when you put your home on the market is the first step to setting realistic expectations. Much like when you go to see a doctor about a procedure, it’s natural to feel some anxiety. You want to know everything you can about what’s being done, what your chances of success are, and how you can be expected to feel during and after. Putting your home up for sale can also feel uncertain, as there is no guarantee that it will sell. The more information you have up front, the better decisions you can make, and the higher the likelihood that you’ll be successful.
As I said in last month’s newsletter, many home sellers are feeling frustrated, and for valid reasons. The Listing Success Rate is just one data point among many, and it does not account for price reductions or increased days on market. The home sellers who sold in any given period of time were only successful because they understood the market they were in and adjusted as required. As the numbers illustrate, the majority of homes are, in fact, successfully selling. But, as stated before, they’re not selling for as much, nor as quickly as they once were. If you are considering selling your home and would like to discuss the market and your specific situation, please give me a call. I’d love to talk nerdy with you :)